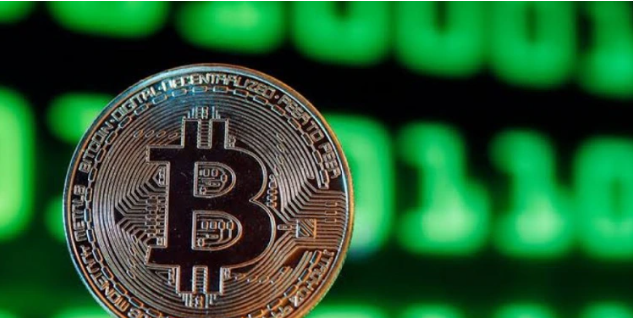
Bitcoin has risen up from Mid-August Lows amid Growing Economic Uncertainty.
Newsonline understands that as investors continued to mull over the most recent inflation figures and lingering macroeconomic uncertainties, most crypto assets breathed heavily throughout the weekend following Friday’s sharp price decline.
Wike vs Atiku: Ayu, BoT Chair, Atiku All North; Ayu Must Leave- Walid Jibrin
The flagship crypto on the daily chart was still down by around 13% week to date, its lowest weekly performance since mid-August. Recently, Bitcoin was up more than 1% for the day and was trading at around $21.5K. At one time, the largest cryptocurrency by market capitalization fell by more than 9%. Friday came after an unexpectedly poor inflation report from Germany, the largest economy in Europe by GDP, and fresh worries about the rate at which interest rates are rising in the United States.
Investors, who were already on edge due to market declines in the US housing sector, became even more so. But on-chain signs imply that Bitcoin’s correction phase could be coming to a close.
Based on Glassnode data, since reaching an all-time high in May 2022, the long-term holder’s supply has slightly decreased by -200K BTC, although it has remained essentially range-bound throughout the past 12 months. This shows that the cohort’s inflow/outflow dynamic is generally balanced.
On the other hand, the supply of short-term holders has increased by +330k BTC as a result of a price capitulation.
There has been a net transfer of -300k BTC from the combined LTHs and exchanges to STHs since the May collapse of LUNA. This broadly depicts a capitulation-style event given the associated price decreases, as the increasing short-term holders’ supply describes accumulation by buyers who entered during the flush out and now possess coins with a considerably reduced value.
However, considering the asset’s past recoveries during prior weak markets, several analysts question whether the current Bitcoin price recovery runs the risk of becoming a misleading bullish indicator.
During the 2018 bear market cycle, the price of BTC increased by about 100%, going from about $6K to over $11.5K, only to completely wipe all the profits and fall to roughly $3K. Notably, comparable corrections and rebounds also occurred in 2019 and 2022.


